Tell Me a Story
A great many times, when we start a project related to the semantic web, people go directly to creating the directed graphs, drawing the data model on the white board. These are classes, those are properties. So the discussion focuses on the creation of the data model, the schema, the implementation, as most of the time people are talking about RDFs and OWL.
But wait … slow down folks. Before we get to implementing anything, tell me a Story. The story is the narrative. It draws out the main ideas that you’re wanting to express in your work. Write about what someone is wanting to accomplish, why they want to accomplish it, what they are researching, measurements they might be using to generate a plot or graph or image or whatever. Describe where they are getting their data, how they are getting it, what they are looking for when they get their data, how they wish they could get their data. Tell me a story using a natural language. Even draw me a picture.
Senator Smith, from the great state of Meh, has just received a PDF of the Ecosystem Status Report from his science team. He reads that the document is generated every two years by various organizations and scientists regarding the health of the environment, tracking changes in key indicators of climate, physical forcing, ecosystem dynamics, and the role of humans in this system. One of the chapters in the document contains information that the Senator wants to learn more about, to discover what information was used to generate a statement in the document.
The Senator clicks on the plot related to the statement. By clicking on the plot he is taken to a splash page for the image, generated from the semantic expression of the plot. Included in the page is information about how the plot was created, from an IPytjon Notebook that loaded a couple of datasets, who created the plot, what role that person plays and for what organization. If he wanted to he could learn that an IPython Notebook is a collection of cells, each cell containing code that is run that does certain things, like loading a data file containing measurements or derived measurements of a particular indicator, and plotting it. The Senator finds out who ran the notebook to generate the plot, who wrote the code that generates the plot, where the dataset came from, the definition of the indicator and other measurements, and continues to click on datasets that were used to derive the current dataset until he gets to the original dataset of measurements taken on a cruise hosted by the Woods Hole Oceanographic Institution with PI Tony Sullivan.
There’s the story. The story is what we need to start with.
From this story we can then pull out the information and relationships that we need to model. But still we’re not talking about a data model. No! What we want to do now is develop the information model. List the concepts. List the relationships between the concepts. What do we want to keep track of and what do we want to link together?
From the story above we see that there is a ecosystem status report, which is a document. That document has chapters. And in the chapters there are images, graphs, plots, citations, references to other documents and referenced datasets. The plots, images, graphs, etc… are clickable. The plot was generated from the IPython notebook that has cells, authors, and someone who ran the notebook. The plot was created in a cell in the notebook, the cell has an author and the cell loads a data file in from a dataset derived from datasets collected on a cruise run by WHOI for a project with a PI. The data can be traced back to an organization, and funding information (should have citation information and licensing information as well). On the cruise was an instrument with a sensor attached that collected the data that is in the dataset. The cruise is a deployment of a ship that is owned by WHOI and was, for this deployment, captained by Captain Phillips.
Wow, this use case contains a LOT of information.
The creation of this story is one of the first pieces of the semantic web iterative methodology that was developed at the Tetherless World Constellation of Rensselaer Polytechnic Institute by Peter Fox and Deborah McGuinness.
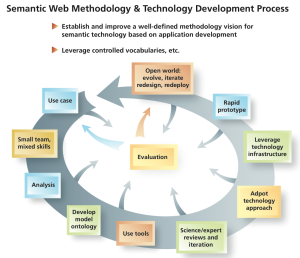
Semantic Web Methodology and Technology Development Process
Another first step in the process is bringing together a small set of diverse people from various fields who will participate in the telling of the story and the implementation of the story. In many of these projects I play the role of the information modeler. Sometimes the project manager. In some I play the role of the system architect, and in many the role of a software engineer. Those last two are my favorite, by the way.
As a software engineer I see a whole set of software use cases related to this story. So I use the term use case different from the way the methodology describes it. I would consider the methodology use case as the story. And from the story you develop a whole set of implementation use cases, project management use cases, modeling use cases, etc…
Each of these use cases are much, much smaller in scope and fit the classic definition of a use case. The use cases are formalized, link to requirements documents and specific implementation information. Pieces of that are turned into tickets that are assigned to an individual and are clear in their expectations. These tickets can be organized and prioritized, fit into a schedule, assigned to an agile sprint, and can eventually be marked as completed.
Once the tasks for a use case are completed the use case can be marked as completed. Once the use cases for the story are completed the story can then have a happy ending. At each step a sense of accomplishment at the completion of something.
All that information that I talked about in the beginning is more then just a technical accomplishment. The information represents knowledge. There’s information about all that went into the completion of that Ecosystem Status Report so now it can be recognized and referenced. The importance of each step is revealed, how the information is being collected, who collected it, and the value of all of that information and the value of each of the steps. An appreciation for the hard work and the resources that went into the report are more apparent.


